Industry tax profiles
Each year the ATO publishes data extracted from tax returns for all Australian taxpayers, with the latest data set capturing the 2022 financial year. Our interactive dashboard below summarises some of the key annual data points for company taxpayers over the 2016-2022 financial years, allowing users to filter by industry group and year.
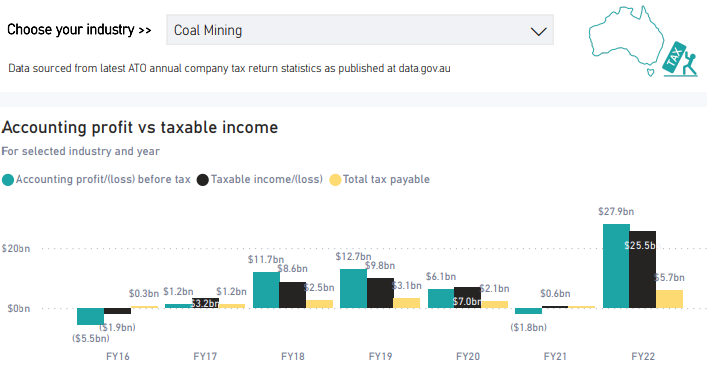
Given the media is often distracted by a comparison of total income vs tax payable (as this is how the annual Corporate Tax Transparency Report data is presented), our focus has been on providing context to the difference in total income and taxable income (i.e. taxable profit).
The data provides some interesting insights as to the accounting and tax profiles of different industries (noting that 2021 data is the first data set that includes an entire income year impacted by COVID-19).
Click on the full screen mode (in desktop) for the best experience…
Disclaimer:
As acknowledged by the ATO, there are some gremlins in the ATO data sets due to incomplete information. This may mean that certain subtotals in the ATO data often do not agree to the sum of the individual line items. Our data model and report uses the individual tax return disclosure line items across the data sets to calculate the relevant totals presented in the dashboard. As a result, this may create a difference in the totals presented in this report compared to the corresponding totals presented in the ATO data set.